


2023: our wettest year yet
How wet was 2023 for you? In Invergowrie, it was very wet, according to our full year weather data.
We recorded a total of 995.4 mm of rainfall, the most we have ever recorded since records began in 1954.
The next wettest year we have on record was 2002, during which we recorded 979.8 mm of rain.
But it wasn’t all rain. In fact, it was quite sunny – the 13th sunniest year, with a total of 1556.3hrs – reflecting the intensity of the rainfall we saw in 2023, particular during big storm events like Babet and Gerrit, near the end of the year.
Indeed, December 2023 was the second wettest December we have ever recorded, with 147.3 mm of rain (the wettest December was in 1977, with 215.6 mm of rain), at 227% of the long-term average levels. The wettest day in December was the 27th, during storm Gerrit.
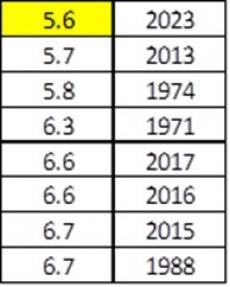
But it was also the eighth warmest December on our records, at 5.6ºC, a whole 2ºC above the long-term average, with a high of 12.6ºC on December 17 and 18 and a low of -4.8ºC on December 2. The 10 warmest years are shown in the table below.
This was despite being the seventeenth dullest December recorded (held jointly with 1995 and 1982)
December 2023 Data
1. Air Mean Temperature: Daily Air Mean = 5.6ºC
Lta Air Mean = 7.6ºC
Difference = 2.0ºC
Highest Air Temperature = 12.6 ºC on date: 17+18/12/2023
Lowest Air Temperature = -4.8 ºC on date: 02/12/2023
2. Rainfall: Total Rainfall = 147.3 mm
Lta Rainfall = 64.9 mm
Actual = 227% of LTA
Highest daily rainfall = 22.5mm on date:27/12/2023
3. Sunshine: Total Sunshine = 33 hrs
Lta Sunshine = 43.6 hrs
Actual = 75.7% of LTA
* Note: LTA = Long Term Average (30 YEAR LONG TERM AVERAGE 1991-2020)
Please account for the fact this 30-year average is missing maximum air temperature readings between September-December 2017 due to The Met office removal of all mercury thermometers.
Disclaimer: The views expressed in this blog post are the views of the author(s), and not an official position of the institute or funder.

Comments
Post new comment